Perfetto
STDIO将自然语言转换为Perfetto跟踪分析的MCP服务器
将自然语言转换为Perfetto跟踪分析的MCP服务器

Turn natural language into powerful Perfetto trace analysis
A Model Context Protocol (MCP) server that transforms natural-language prompts into focused Perfetto analyses. Quickly explain jank, diagnose ANRs, spot CPU hot threads, uncover lock contention, and find memory leaks – all without writing SQL.

brew install [email protected]
brew install uv
Or add to ~/.cursor/mcp.json (global) or .cursor/mcp.json (project):
{
  "mcpServers": {
    "perfetto-mcp": {
      "command": "uvx",
      "args": ["perfetto-mcp"]
    }
  }
}
Run this command. See Claude Code MCP docs for more info.
# Add to user scope
claude mcp add perfetto-mcp --scope user -- uvx perfetto-mcp
Or edit ~/claude.json (macOS) or %APPDATA%\Claude\claude.json (Windows):
{
  "mcpServers": {
    "perfetto-mcp": {
      "command": "uvx",
      "args": ["perfetto-mcp"]
    }
  }
}
or add to .vscode/mcp.json (project) or run "MCP: Add Server" command:
{
  "mcpServers": {
    "perfetto-mcp": {
      "command": "uvx",
      "args": ["perfetto-mcp"]
    }
  }
}
Enable in GitHub Copilot Chat's Agent mode.
Edit ~/.codex/config.toml:
[mcp_servers.perfetto-mcp]
command = "uvx"
args = ["perfetto-mcp"]
cd perfetto-mcp-server
uv sync
uv run mcp dev src/perfetto_mcp/dev.py
{
  "mcpServers": {
    "perfetto-mcp-local": {
      "command": "uv",
      "args": [
        "--directory",
        "/path/to/git/repo/perfetto-mcp",
        "run",
        "-m",
        "perfetto_mcp"
      ],
      "env": { "PYTHONPATH": "src" }
    }
  }
}
pip3 install perfetto-mcp
python3 -m perfetto_mcp
Example starting prompt:
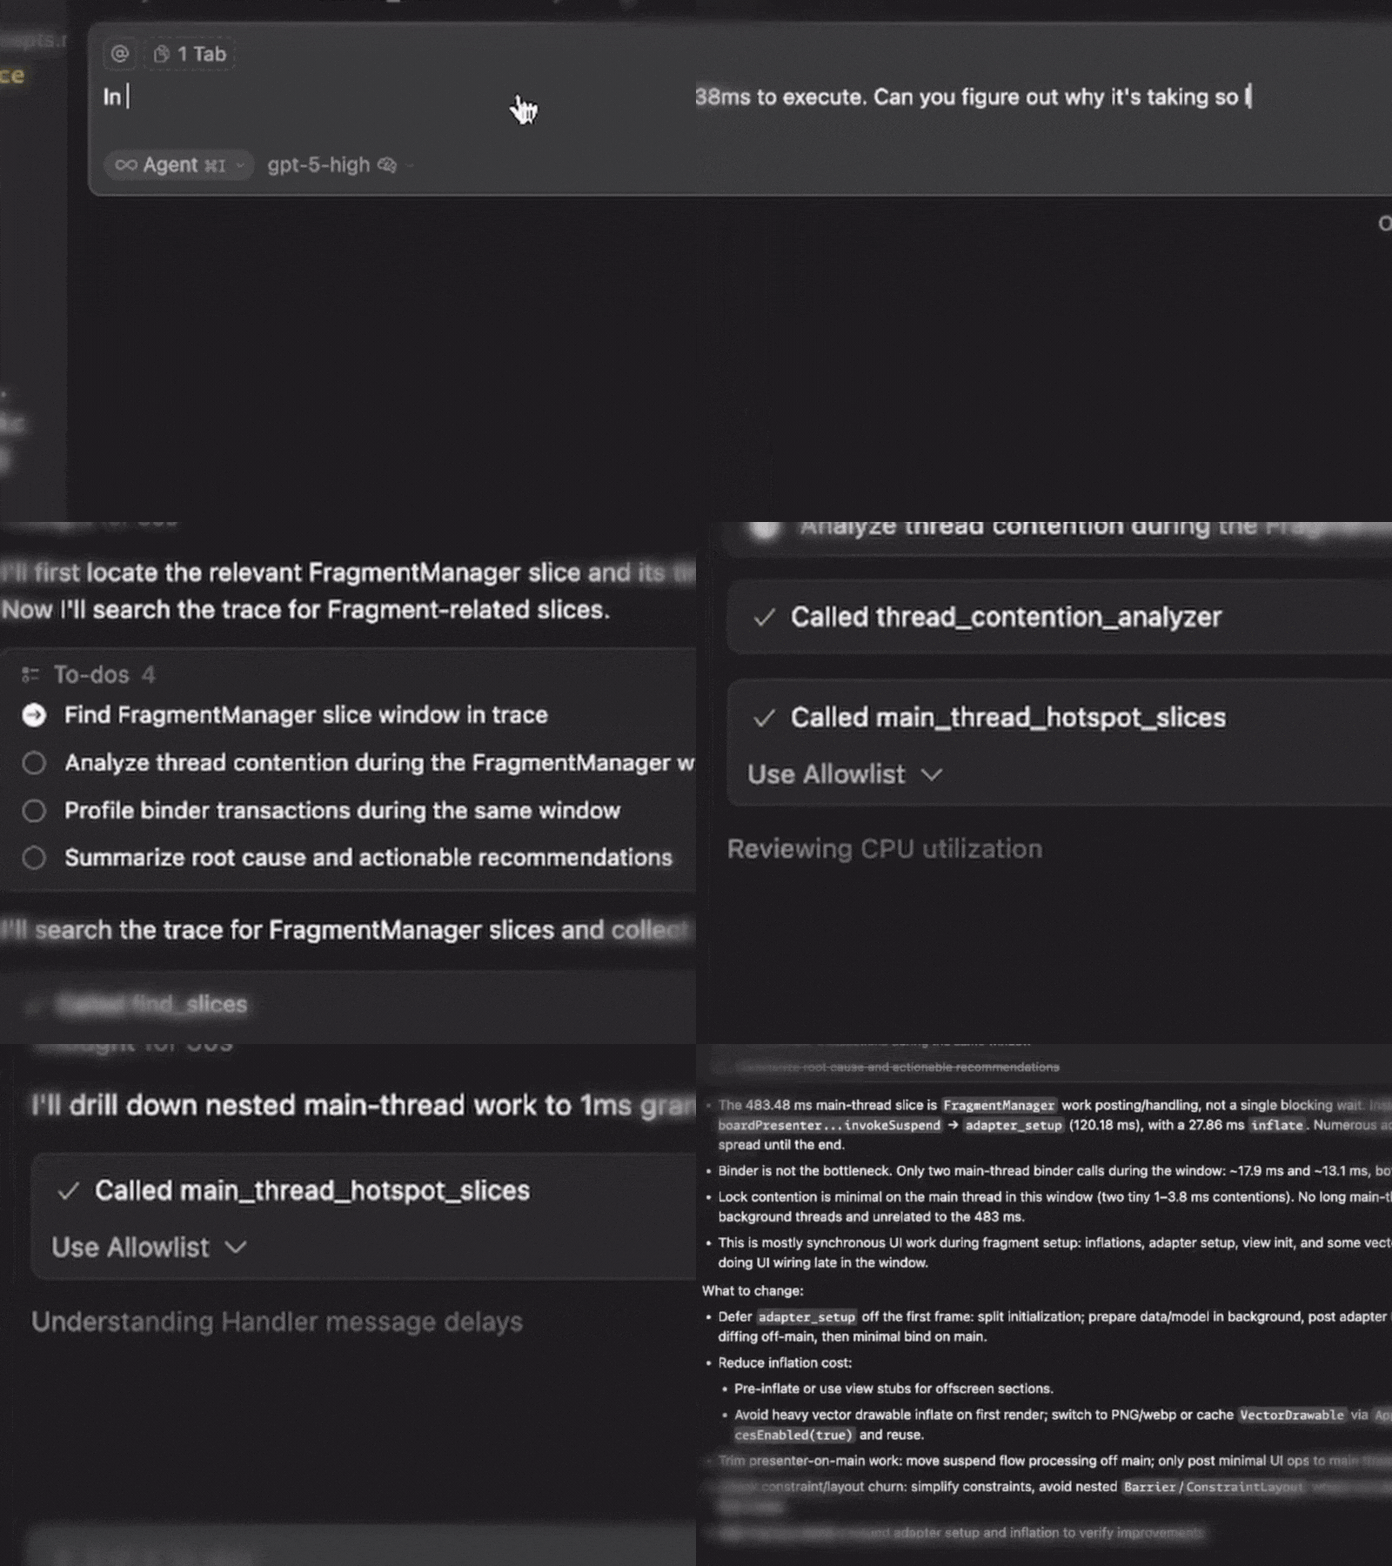
In the perfetto trace, I see that the FragmentManager is taking 438ms to execute. Can you figure out why it's taking so long?
Every tool needs these two inputs:
| Parameter | Description | Example |
|---|---|---|
| trace_path | Absolute path to your Perfetto trace | /path/to/trace.perfetto-trace |
| process_name | Target process/app name | com.example.app |
Be explicit about the trace and process, prefix your prompt with:
"Use perfetto trace /absolute/path/to/trace.perfetto-trace for process com.example.app"
Many tools support additional filtering (but let your LLM handle that):
{start_ms: 10000, end_ms: 25000}min_block_ms, jank_threshold_ms, limit| Tool | Purpose | Example Prompt |
|---|---|---|
find_slices | Survey slice names and locate hot paths | "Find slice names containing 'Choreographer' and show top examples" |
execute_sql_query | Run custom PerfettoSQL for advanced analysis | "Run custom SQL to correlate threads and frames in the first 30s" |
Note: Helpful if the recorded trace contains ANR
| Tool | Purpose | Example Prompt |
|---|---|---|
detect_anrs | Find ANR events with severity classification | "Detect ANRs in the first 10s and summarize severity" |
anr_root_cause_analyzer | Deep-dive ANR causes with ranked likelihood | "Analyze ANR root cause around 20,000 ms and rank likely causes" |
| Tool | Purpose | Example Prompt |
|---|---|---|
cpu_utilization_profiler | Thread-level CPU usage and scheduling | "Profile CPU usage by thread and flag the hottest threads" |
main_thread_hotspot_slices | Find longest-running main thread operations | "List main-thread hotspots >50 ms during 10s–25s" |
| Tool | Purpose | Example Prompt |
|---|---|---|
detect_jank_frames | Identify frames missing deadlines | "Find janky frames above 16.67 ms and list the worst 20" |
frame_performance_summary | Overall frame health metrics | "Summarize frame performance and report jank rate and P99 CPU time" |
| Tool | Purpose | Example Prompt |
|---|---|---|
thread_contention_analyzer | Find synchronization bottlenecks | "Find lock contention between 15s–30s and show worst waits" |
binder_transaction_profiler | Analyze Binder IPC performance | "Profile slow Binder transactions and group by server process" |
| Tool | Purpose | Example Prompt |
|---|---|---|
memory_leak_detector | Find sustained memory growth patterns | "Detect memory-leak signals over the last 60s" |
heap_dominator_tree_analyzer | Identify memory-hogging classes | "Analyze heap dominator classes and list top offenders" |
All tools return structured JSON with:
Apache 2.0 License. See LICENSE for details.