icon for mcp server

MCPHawk

STDIO

MCP协议流量日志监控解决方案

MCPHawk Logo

CI codecov Python Typer FastAPI Vue.js Ruff PEP8 License: MIT

MCPHawk is a new Logging & Monitoring solution for Model Context Protocol (MCP) traffic, providing deep visibility into MCP client-server interactions. It started off as a mix between Wireshark and mcpinspector, purpose-built for the MCP ecosystem, and is now slowly turning into something more.

Key Capabilities:
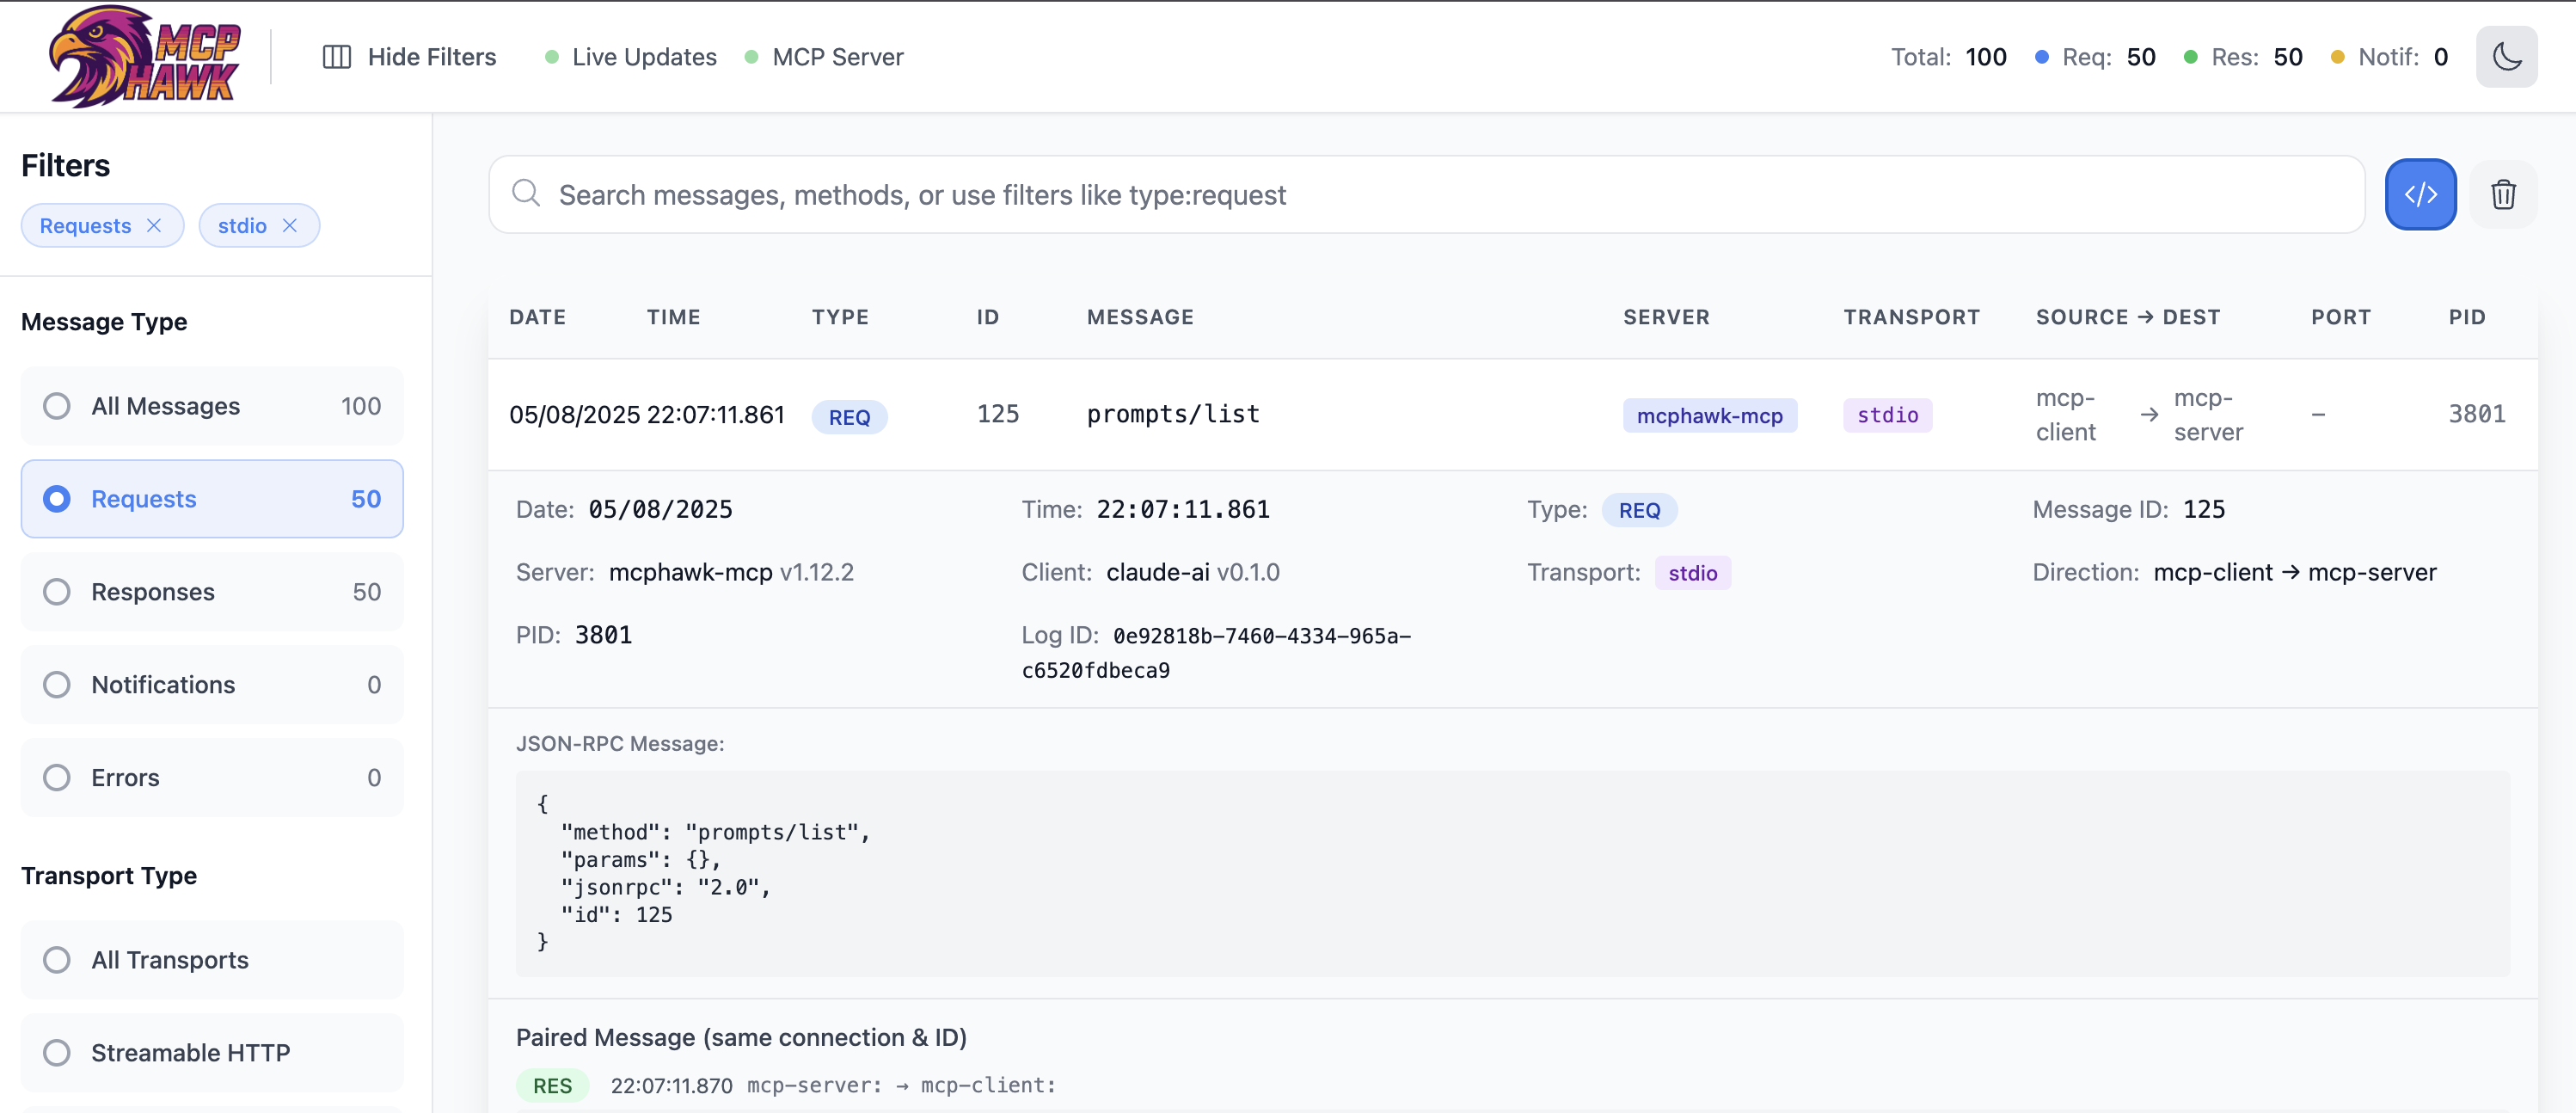
  • Protocol-Aware Capture: Understands MCP's JSON-RPC 2.0 transport layer, capturing and reassembling messages from stdio pipes and HTTP streams
  • Transport Agnostic: Monitors MCP traffic across all standard transports (stdio, HTTP Streaming, HTTP+SSE)
  • Full Message Reconstruction: Advanced stream reassembly handles fragmented packets, chunked HTTP transfers, SSE streams, and stdio pipes
MCPHawk Screenshot

Core Features

🔍 MCP Protocol Analysis

  • Complete JSON-RPC 2.0 Support: Correctly identifies and categorizes all MCP message types
    • Requests: Method calls with unique IDs for correlation
    • Responses: Success results and error responses with matching IDs
    • Notifications: Fire-and-forget method calls without IDs
    • Batch Operations: Support for JSON-RPC batch requests/responses
  • Transport-Specific Handling: See MCP Transport Support table below for full details
    • Chunked Transfer: Handles HTTP chunked transfer encoding transparently
  • Protocol Compliance: Validates JSON-RPC 2.0 structure and MCP-specific extensions

🚀 Advanced Capture Capabilities

  • Auto-Discovery Mode: Intelligently detects MCP traffic on any port using pattern matching
  • TCP Stream Reassembly: Reconstructs complete messages from fragmented packets
  • Multi-Stream Tracking: Simultaneously monitors multiple MCP client-server connections
  • IPv4/IPv6 Dual Stack: Native support for both IP protocols
  • Zero-Copy Architecture: Efficient packet processing without client/server overhead

📊 Analysis & Visualization

  • Real-Time Web Dashboard: Live traffic visualization with WebSocket updates
  • Message Flow Visualization: Track request-response pairs using JSON-RPC IDs
  • Traffic Statistics: Method frequency, error rates, response times
  • Search & Filter: Query by method name, message type, content patterns
  • Export Capabilities: Save captured sessions for offline analysis

🛠️ Developer Experience

  • MCP Server Integration: Query captured data using MCP protocol itself
    • FastMCP-based implementation for maximum compatibility
    • Available tools: query_traffic, search_traffic, get_stats, list_methods
    • Supports both stdio and HTTP transports
  • Multiple Interfaces:
    • Web UI for interactive exploration
    • CLI for scripting and automation
    • MCP server for programmatic access
  • Flexible Deployment:
    • Standalone sniffer mode
    • Integrated web + sniffer
    • Historical log analysis without active capture

MCP Transport Support

Official MCP TransportProtocol VersionCapture SupportDetails
stdioAll versions✅ FullProcess wrapper transparently captures stdin/stdout between client and server
HTTP Streaming2025-03-26+✅ FullHTTP POST with optional SSE streaming responses
HTTP+SSE (deprecated)2024-11-05✅ FullLegacy transport with separate SSE endpoint

Note: Raw TCP traffic with JSON-RPC is also captured and marked as "unknown" transport type

Comparison with Similar Tools

FeatureMCPHawkmcpinspectorWireshark
Passive sniffing (no proxy needed)
MCP/JSON-RPC protocol awareness
SSE/Chunked HTTP support
TCP stream reassembly
Auto-detect MCP traffic
Web UI for live/historical traffic
JSON-RPC message type detection
MCP server for data access
No client/server config needed
Interactive testing/debugging
Proxy/MITM capabilities✅ (stdio)

When to use each tool:

  • MCPHawk: Passive monitoring, protocol analysis, debugging MCP implementations, understanding traffic patterns
  • mcpinspector: Active testing, crafting requests, interactive debugging with proxy
  • Wireshark: General network analysis, non-MCP protocols, packet-level inspection

TLS/HTTPS Limitations

MCPHawk captures unencrypted MCP traffic only. It cannot decrypt:

  • HTTPS/WSS (WebSocket Secure) connections
  • TLS-encrypted TCP connections
  • Any SSL/TLS encrypted traffic

This tool is ideal for:

  • 🛠️ Local MCP development - Debug your MCP server implementations
  • 🔍 Understanding MCP protocol - See actual JSON-RPC message flow
  • 🐛 Troubleshooting local tools - Monitor Claude Desktop, Cline, etc. with YOUR local MCP servers
  • 📊 Development/staging environments - Where TLS is often disabled

Installation

For Users

# Install from PyPI pip install mcphawk # Or install directly from GitHub pip install git+https://github.com/tech4242/mcphawk.git

Requirements

  • macOS/Linux: Requires sudo for packet capture (standard for network sniffers)
  • Python: 3.9 or higher
  • Permissions: Must run with elevated privileges to access network interfaces

Quick Start

# Get help mcphawk --help # Get help for specific command mcphawk sniff --help mcphawk web --help # Start web UI with auto-detect mode (requires sudo on macOS) sudo mcphawk web --auto-detect # Monitor MCP traffic on a specific port (console output) sudo mcphawk sniff --port 3000 # Monitor multiple ports with a custom filter sudo mcphawk sniff --filter "tcp port 3000 or tcp port 8080" # Auto-detect MCP traffic on any port sudo mcphawk sniff --auto-detect # Start web UI with sniffer on specific port sudo mcphawk web --port 3000 # Start web UI with custom filter for multiple ports sudo mcphawk web --filter "tcp port 3000 or tcp port 8080" # View historical logs only (no active sniffing) sudo mcphawk web --no-sniffer # Custom web server configuration sudo mcphawk web --port 3000 --host 0.0.0.0 --web-port 9000 # Enable debug output for troubleshooting sudo mcphawk sniff --port 3000 --debug sudo mcphawk web --port 3000 --debug # Wrap an MCP server to capture stdio traffic mcphawk wrap /path/to/mcp-server --arg1 --arg2 # Example: Wrap Context7 MCP server to monitor Claude Desktop's documentation lookups mcphawk wrap npx -y @upstash/context7-mcp@latest # Claude Desktop config to use the wrapped version: # { # "mcpServers": { # "context7": { # "command": "mcphawk", # "args": ["wrap", "npx", "-y", "@upstash/context7-mcp@latest"] # } # } # } # Start MCP server with Streamable HTTP transport (default) mcphawk mcp --transport http --mcp-port 8765 # Start MCP server with stdio transport (for Claude Desktop integration) mcphawk mcp --transport stdio # Start sniffer with integrated MCP server (HTTP transport) sudo mcphawk sniff --port 3000 --with-mcp --mcp-transport http # Start web UI with integrated MCP server sudo mcphawk web --port 3000 --with-mcp --mcp-transport http --mcp-port 8765

MCP Server Integration

MCPHawk includes a built-in MCP server, allowing you to query captured traffic through the Model Context Protocol itself. This creates powerful possibilities:
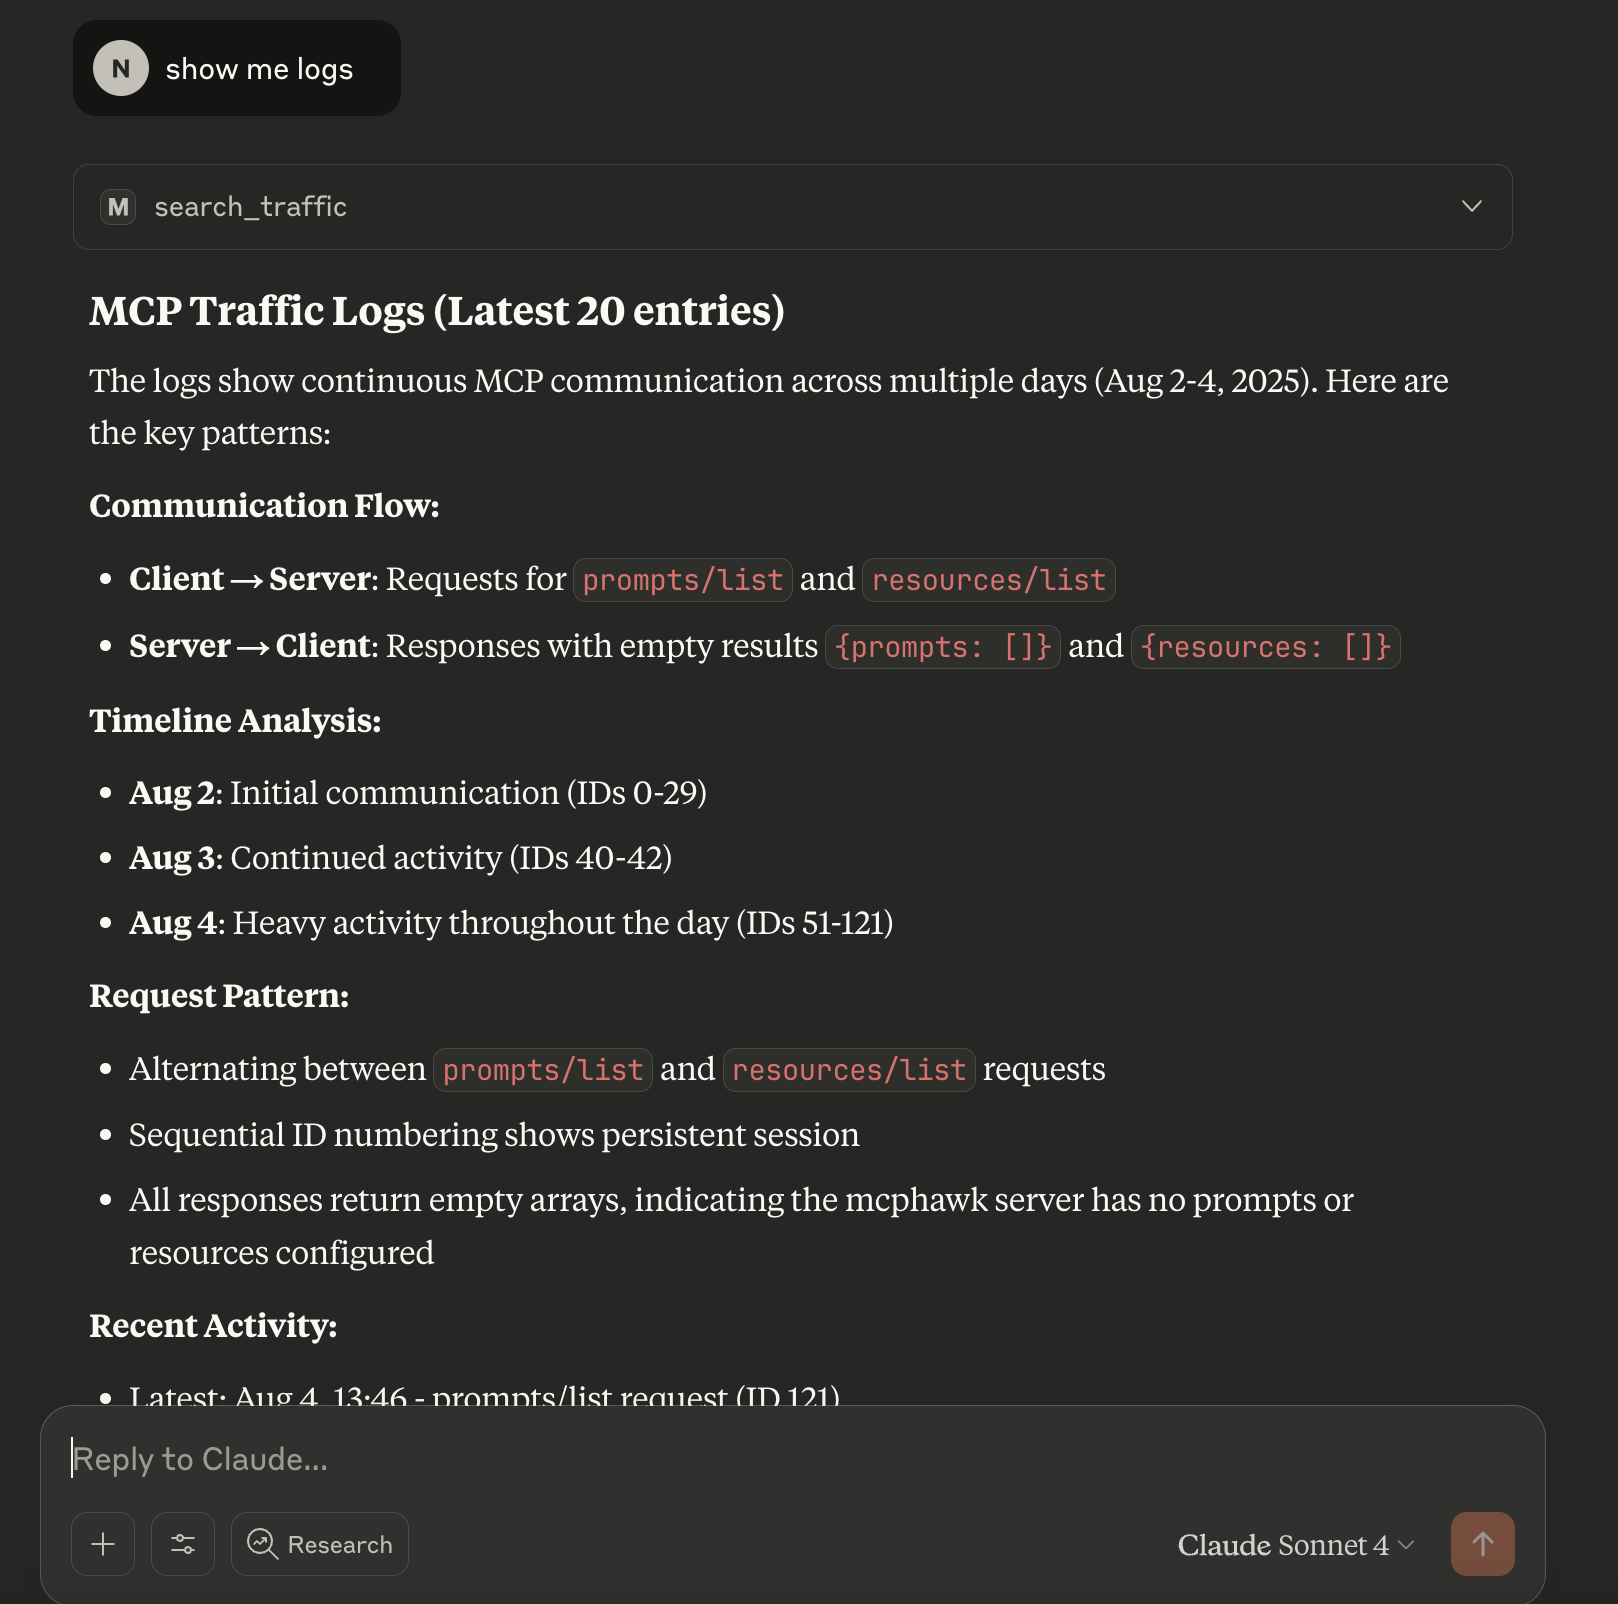
  • AI-Powered Analysis: Connect Claude or other LLMs to analyze traffic patterns
  • Automated Monitoring: Build agents that detect anomalies or specific behaviors
  • Integration Testing: Programmatically verify MCP interactions in CI/CD pipelines
MCPHawk Claude Desktop MCP

Available Tools

The MCP server exposes these tools for traffic analysis:

ToolDescriptionParameters
query_trafficFetch captured logs with paginationlimit, offset
get_logRetrieve specific log entrylog_id
search_trafficSearch logs by content or typesearch_term, message_type, traffic_type, limit
get_statsGet traffic statisticsNone
list_methodsList unique JSON-RPC methodsNone

Transport Options

HTTP Transport (Development & Testing)

The HTTP transport uses Server-Sent Events (SSE) for streaming responses:

# Start MCP server mcphawk mcp --transport http --mcp-port 8765 # Initialize session (note: returns SSE stream) curl -N -X POST http://localhost:8765/mcp \ -H 'Accept: text/event-stream' \ -d '{"jsonrpc":"2.0","method":"initialize","params":{"protocolVersion":"2024-11-05","capabilities":{},"clientInfo":{"name":"test","version":"1.0"}},"id":1}' # Example response (SSE format): # event: message # data: {"jsonrpc":"2.0","id":1,"result":{"protocolVersion":"2024-11-05",...}}

stdio Transport (Production & Claude Desktop)

For Claude Desktop integration:

{ "mcpServers": { "mcphawk": { "command": "mcphawk", "args": ["mcp", "--transport", "stdio"] } } }

The stdio transport follows the standard MCP communication pattern:

  1. Client sends initialize request
  2. Server responds with capabilities
  3. Client sends initialized notification
  4. Normal tool calls can proceed

See examples/mcp_sdk_client.py for HTTP client example or examples/stdio_client.py for stdio communication.

Platform Support

Tested Platforms

  • macOS (Apple Silicon & Intel) - Fully tested
  • Linux (Ubuntu, Debian) - Fully tested
  • ⚠️ Windows - Experimental (Scapy should work but untested)

Known Limitations

  • Requires elevated privileges (sudo) on macOS/Linux for packet capture
  • Limited to localhost/loopback interface monitoring
  • Cannot decrypt TLS/HTTPS traffic (WSS, HTTPS)
  • IPv6 support requires explicit interface configuration on some systems
  • High traffic volumes (>1000 msgs/sec) may impact performance

Troubleshooting

Permission Denied Error:

# On macOS/Linux, use sudo: sudo mcphawk web --auto-detect

No Traffic Captured:

  • Ensure the MCP server/client is using localhost (127.0.0.1 or ::1)
  • Check if traffic is on the expected port
  • Try auto-detect mode to find MCP traffic: --auto-detect
  • Verify traffic is unencrypted (not HTTPS/TLS)
  • On macOS, ensure Terminal has permission to capture packets in System Preferences

SSE/HTTP Responses Not Showing:

  • Confirm the server uses standard SSE format (event: message\ndata: {...}\n\n)
  • Check if responses use chunked transfer encoding
  • Enable debug mode to see detailed packet analysis: --debug

Potential Upcoming Features

Vote for features by opening a GitHub issue!

  • Auto-detect MCP traffic - Automatically discover MCP traffic on any port without prior configuration
  • MCP Server Interface - Expose captured traffic via MCP server for AI agents to query and analyze traffic patterns
  • Stdio capture - Transparent process wrapper to capture stdin/stdout communication
  • Protocol Version Detection - Identify and display MCP protocol version from captured traffic
  • Smart Search & Filtering - Search by method name, params, or any JSON field with regex support
  • Performance Analytics - Request/response timing, method frequency charts, and latency distribution
  • Export & Share - Export sessions as JSON/CSV, generate shareable links, create HAR-like files
  • Test Generation - Auto-generate test cases from captured traffic
  • Error Analysis - Highlight errors, group similar issues, show error trends
  • Session Management - Save/load capture sessions, compare sessions side-by-side
  • Interactive Replay - Click any request to re-send it, edit and replay captured messages
  • Real-time Alerts - Alert on specific methods or error patterns with webhook support
  • Visualization - Sequence diagrams, resource heat maps, method dependency graphs

... and a few more off the deep end:

  • TLS/HTTPS Support (MITM Proxy Mode) - Optional man-in-the-middle proxy with certificate installation for encrypted traffic
  • External Decryption Integration - Import decrypted streams from Wireshark, Chrome DevTools, or SSLKEYLOGFILE

For Developers

# Set up Python environment python3 -m venv .venv source .venv/bin/activate # On Windows: .venv\Scripts\activate # Install backend dependencies pip3 install -r requirements-dev.txt pip3 install -e . # Install frontend dependencies and build cd frontend npm install npm run build cd .. # Run tests python3 -m pytest -v

Some Vue options:

# Option 1: Use make (recommended) make dev # Runs both frontend and backend # Option 2: Run separately # Terminal 1 - Frontend with hot reload cd frontend && npm run dev # Terminal 2 - Backend mcphawk web --port 3000 # Option 3: Watch mode cd frontend && npm run build:watch # Auto-rebuild on changes mcphawk web --port 3000 # In another terminal

MCP Now 重磅来袭,抢先一步体验