
Prometheus
STDIOMCP server for accessing Prometheus metrics data through Model Context Protocol
MCP server for accessing Prometheus metrics data through Model Context Protocol
MCP server for interacting with Prometheus metrics and data.
This is a TypeScript-based MCP server that implements a Prometheus API interface. It provides a bridge between Claude and your Prometheus server through the Model Context Protocol (MCP).
The server requires the following environment variable:
PROMETHEUS_URL: The base URL of your Prometheus instanceOptional authentication configuration:
PROMETHEUS_USERNAME: Username for basic auth (if required)PROMETHEUS_PASSWORD: Password for basic auth (if required)Install dependencies:
npm install
Build the server:
npm run build
For development with auto-rebuild:
npm run watch
To use with Claude Desktop, add the server config:
On MacOS: ~/Library/Application Support/Claude/claude_desktop_config.json
On Windows: %APPDATA%/Claude/claude_desktop_config.json
{
  "mcpServers": {
    "mcp-server-prometheus": {
      "command": "/path/to/mcp-server-prometheus/build/index.js",
      "env": {
        "PROMETHEUS_URL": "http://your-prometheus-instance:9090"
      }
    }
  }
}
Since MCP servers communicate over stdio, debugging can be challenging. We recommend using the MCP Inspector:
npm run inspector
The Inspector will provide a URL to access debugging tools in your browser.
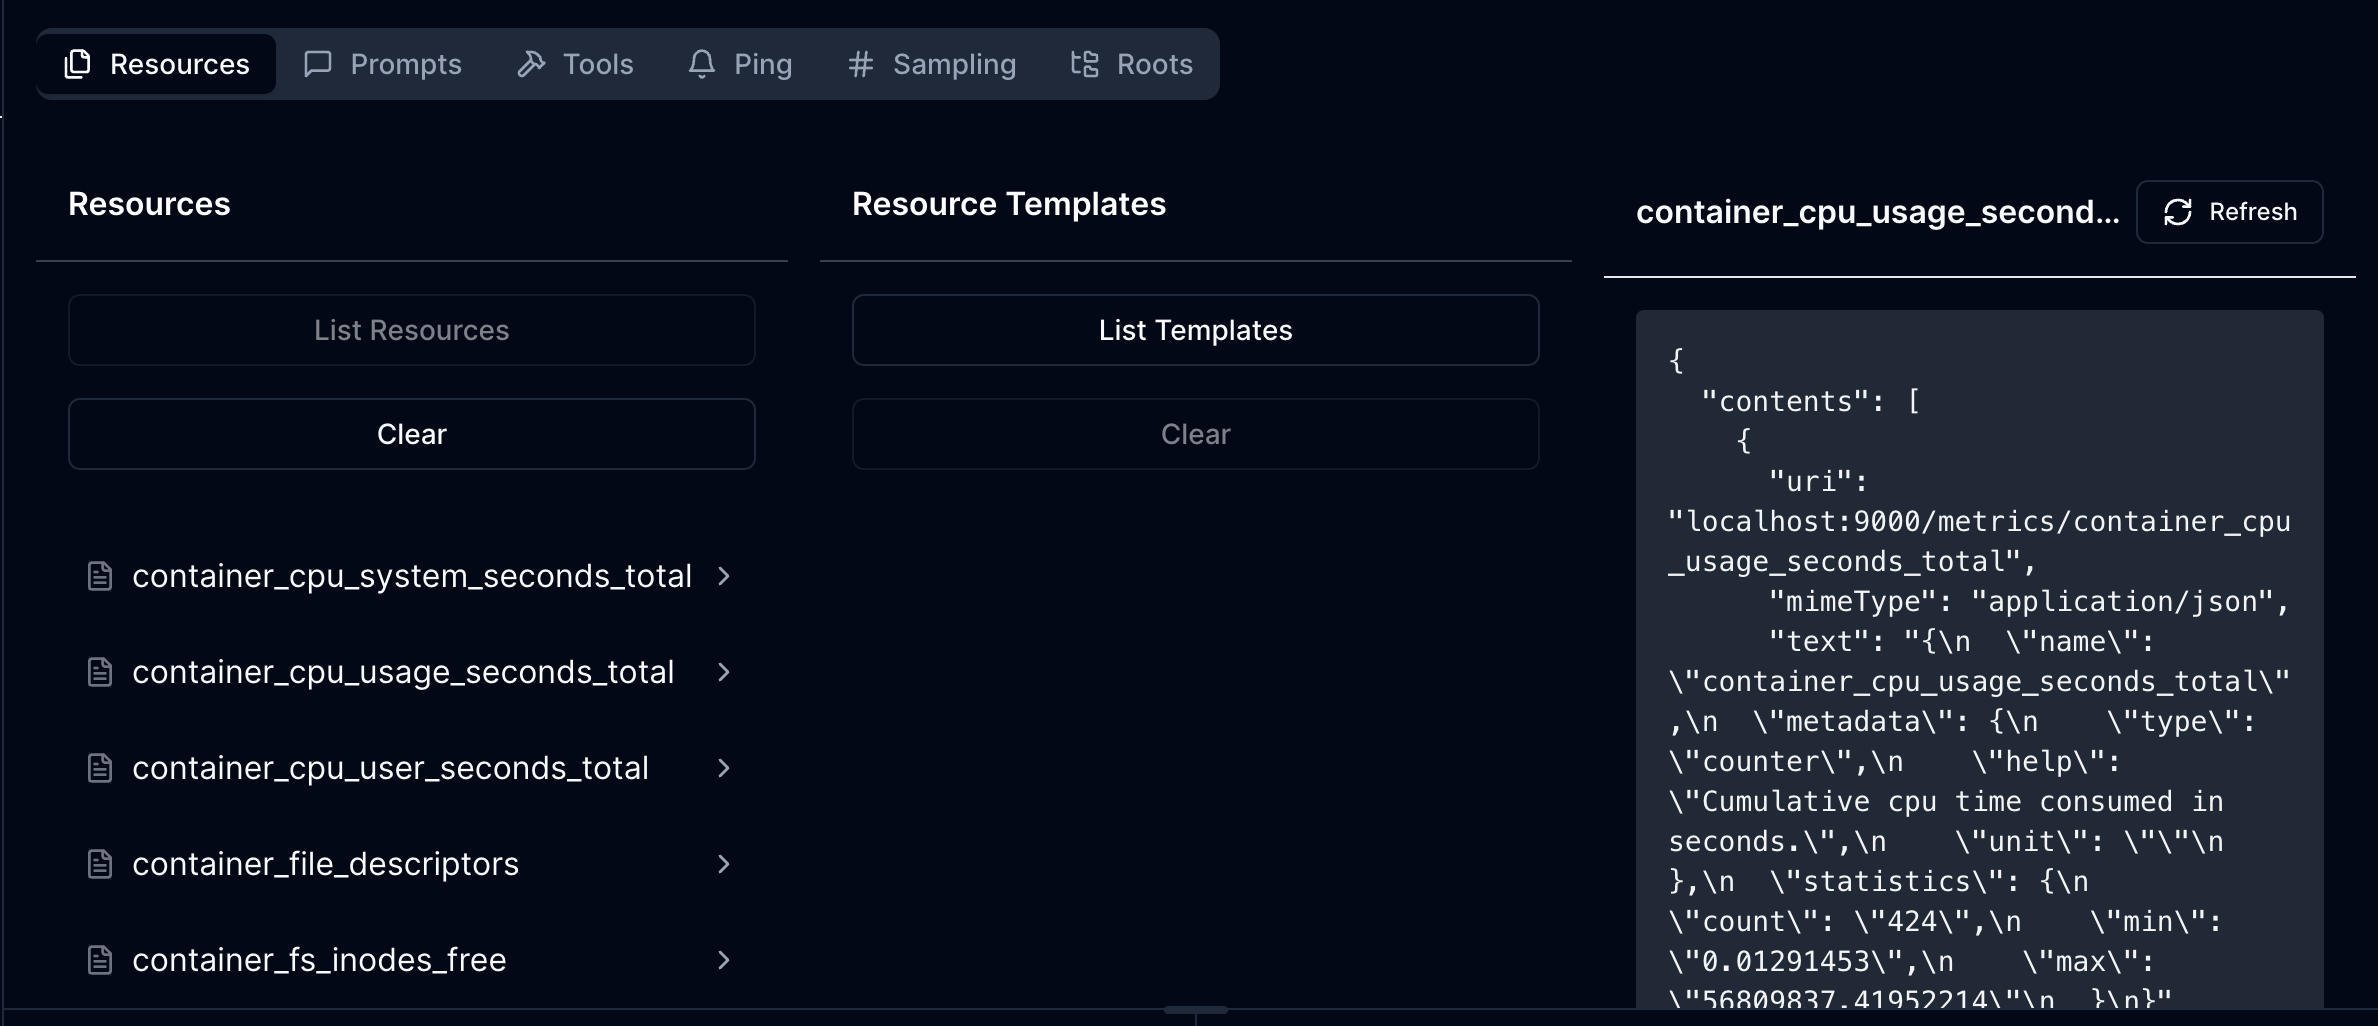
The server exposes Prometheus metrics through the following URI structure:
http://your-prometheus-instance:9090http://your-prometheus-instance:9090/metrics/{metric_name}Each metric resource returns JSON data containing: