Perfetto
STDIOMCP server that transforms natural language into Perfetto trace analysis queries
MCP server that transforms natural language into Perfetto trace analysis queries

Turn natural language into powerful Perfetto trace analysis
A Model Context Protocol (MCP) server that transforms natural-language prompts into focused Perfetto analyses. Quickly explain jank, diagnose ANRs, spot CPU hot threads, uncover lock contention, and find memory leaks – all without writing SQL.

brew install [email protected]
brew install uv
Or add to ~/.cursor/mcp.json (global) or .cursor/mcp.json (project):
{
  "mcpServers": {
    "perfetto-mcp": {
      "command": "uvx",
      "args": ["perfetto-mcp"]
    }
  }
}
Run this command. See Claude Code MCP docs for more info.
# Add to user scope
claude mcp add perfetto-mcp --scope user -- uvx perfetto-mcp
Or edit ~/claude.json (macOS) or %APPDATA%\Claude\claude.json (Windows):
{
  "mcpServers": {
    "perfetto-mcp": {
      "command": "uvx",
      "args": ["perfetto-mcp"]
    }
  }
}
or add to .vscode/mcp.json (project) or run "MCP: Add Server" command:
{
  "mcpServers": {
    "perfetto-mcp": {
      "command": "uvx",
      "args": ["perfetto-mcp"]
    }
  }
}
Enable in GitHub Copilot Chat's Agent mode.
Edit ~/.codex/config.toml:
[mcp_servers.perfetto-mcp]
command = "uvx"
args = ["perfetto-mcp"]
cd perfetto-mcp-server
uv sync
uv run mcp dev src/perfetto_mcp/dev.py
{
  "mcpServers": {
    "perfetto-mcp-local": {
      "command": "uv",
      "args": [
        "--directory",
        "/path/to/git/repo/perfetto-mcp",
        "run",
        "-m",
        "perfetto_mcp"
      ],
      "env": { "PYTHONPATH": "src" }
    }
  }
}
pip3 install perfetto-mcp
python3 -m perfetto_mcp
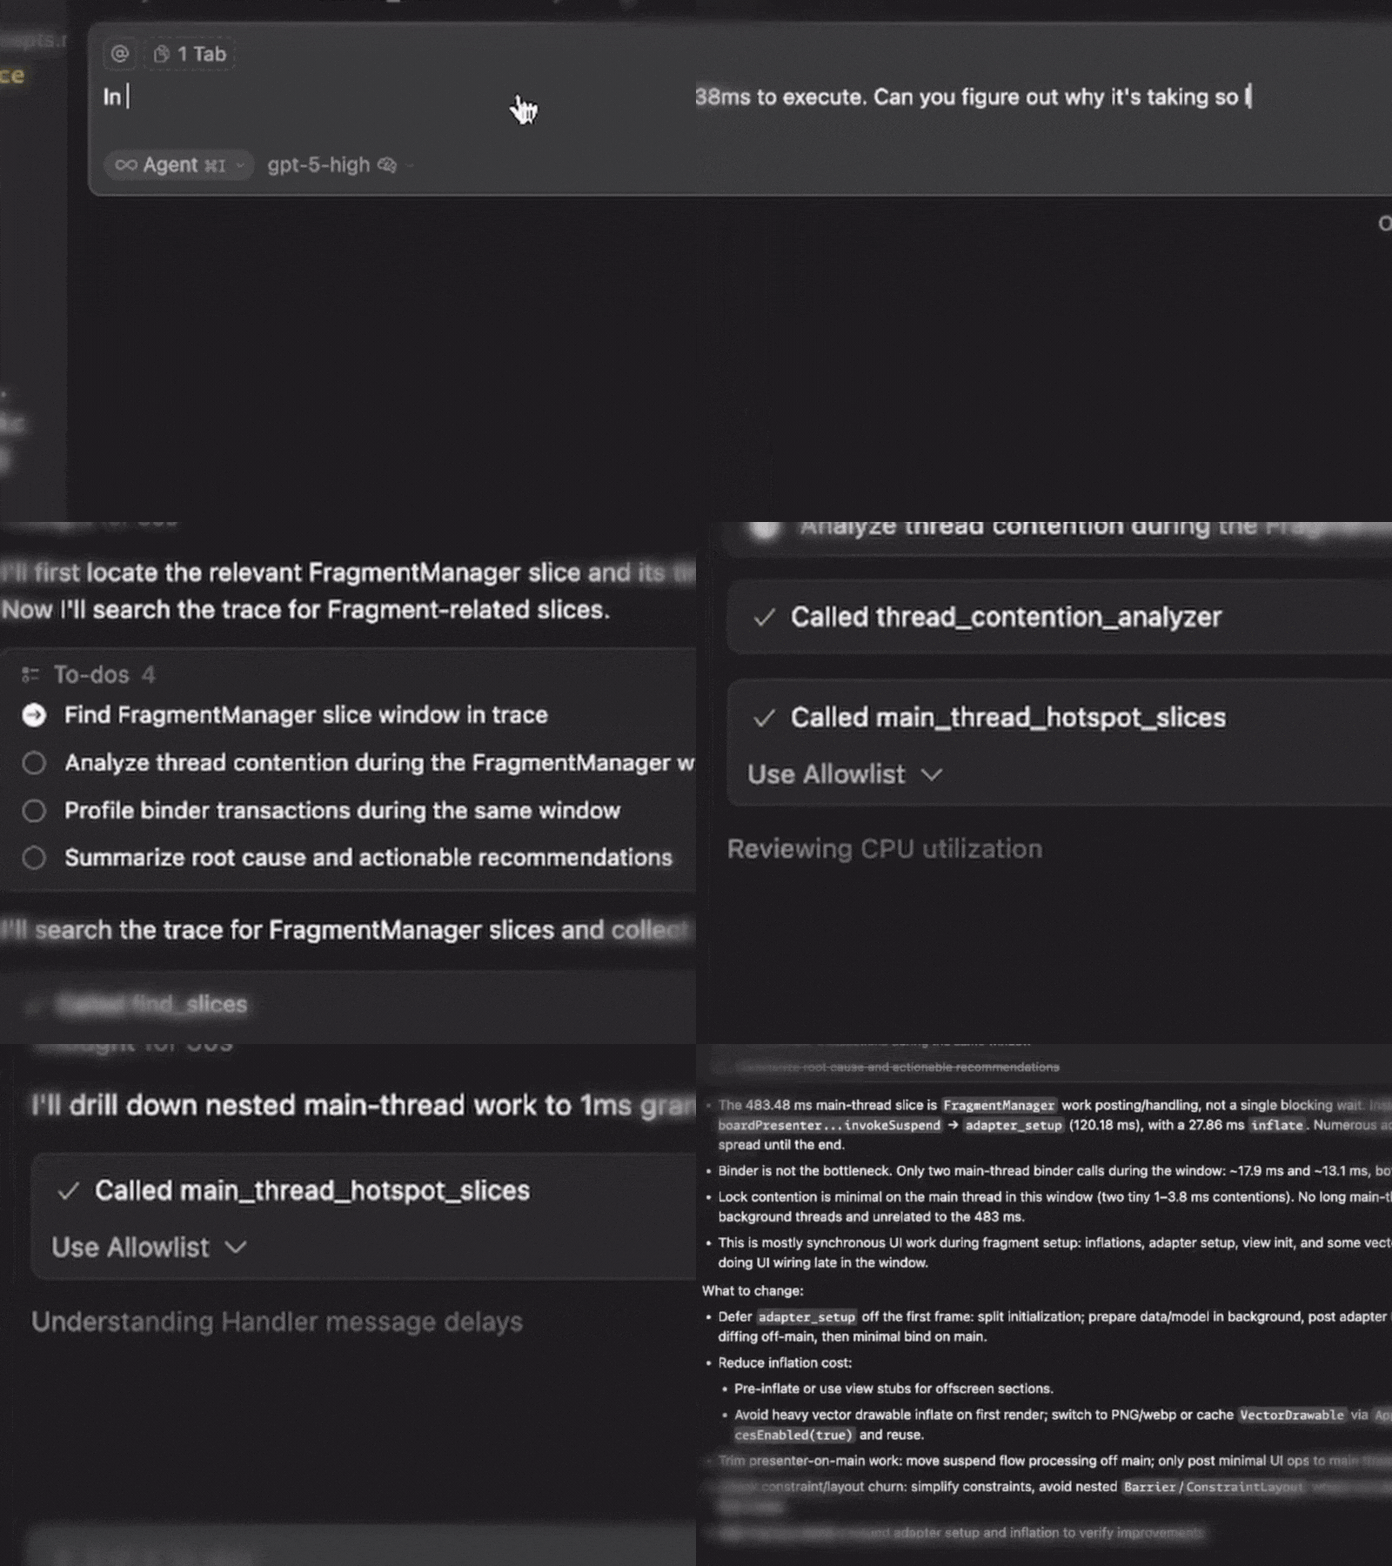
Example starting prompt:
In the perfetto trace, I see that the FragmentManager is taking 438ms to execute. Can you figure out why it's taking so long?
Every tool needs these two inputs:
| Parameter | Description | Example |
|---|---|---|
| trace_path | Absolute path to your Perfetto trace | /path/to/trace.perfetto-trace |
| process_name | Target process/app name | com.example.app |
Be explicit about the trace and process, prefix your prompt with:
"Use perfetto trace /absolute/path/to/trace.perfetto-trace for process com.example.app"
Many tools support additional filtering (but let your LLM handle that):
{start_ms: 10000, end_ms: 25000}min_block_ms, jank_threshold_ms, limit| Tool | Purpose | Example Prompt |
|---|---|---|
find_slices | Survey slice names and locate hot paths | "Find slice names containing 'Choreographer' and show top examples" |
execute_sql_query | Run custom PerfettoSQL for advanced analysis | "Run custom SQL to correlate threads and frames in the first 30s" |
Note: Helpful if the recorded trace contains ANR
| Tool | Purpose | Example Prompt |
|---|---|---|
detect_anrs | Find ANR events with severity classification | "Detect ANRs in the first 10s and summarize severity" |
anr_root_cause_analyzer | Deep-dive ANR causes with ranked likelihood | "Analyze ANR root cause around 20,000 ms and rank likely causes" |
| Tool | Purpose | Example Prompt |
|---|---|---|
cpu_utilization_profiler | Thread-level CPU usage and scheduling | "Profile CPU usage by thread and flag the hottest threads" |
main_thread_hotspot_slices | Find longest-running main thread operations | "List main-thread hotspots >50 ms during 10s–25s" |
| Tool | Purpose | Example Prompt |
|---|---|---|
detect_jank_frames | Identify frames missing deadlines | "Find janky frames above 16.67 ms and list the worst 20" |
frame_performance_summary | Overall frame health metrics | "Summarize frame performance and report jank rate and P99 CPU time" |
| Tool | Purpose | Example Prompt |
|---|---|---|
thread_contention_analyzer | Find synchronization bottlenecks | "Find lock contention between 15s–30s and show worst waits" |
binder_transaction_profiler | Analyze Binder IPC performance | "Profile slow Binder transactions and group by server process" |
| Tool | Purpose | Example Prompt |
|---|---|---|
memory_leak_detector | Find sustained memory growth patterns | "Detect memory-leak signals over the last 60s" |
heap_dominator_tree_analyzer | Identify memory-hogging classes | "Analyze heap dominator classes and list top offenders" |
All tools return structured JSON with:
Apache 2.0 License. See LICENSE for details.