icon for mcp server

JMeter Test Executor

STDIO

MCP server that allows executing JMeter tests through MCP-compatible clients.

🚀 JMeter MCP Server

This is a Model Context Protocol (MCP) server that allows executing JMeter tests through MCP-compatible clients and analyzing test results.

[!IMPORTANT] 📢 Looking for an AI Assistant inside JMeter? 🚀 Check out Feather Wand

Anthropic Cursor Windsurf

📋 Features

JMeter Execution

  • 📊 Execute JMeter tests in non-GUI mode
  • 🖥️ Launch JMeter in GUI mode
  • 📝 Capture and return execution output
  • 📊 Generate JMeter report dashboard

Test Results Analysis

  • 📈 Parse and analyze JMeter test results (JTL files)
  • 📊 Calculate comprehensive performance metrics
  • 🔍 Identify performance bottlenecks automatically
  • 💡 Generate actionable insights and recommendations
  • 📊 Create visualizations of test results
  • 📑 Generate HTML reports with analysis results

🛠️ Installation

Local Installation

  1. Install uv:

  2. Ensure JMeter is installed on your system and accessible via the command line.

⚠️ Important: Make sure JMeter is executable. You can do this by running:

chmod +x /path/to/jmeter/bin/jmeter
  1. Install required Python dependencies:
pip install numpy matplotlib
  1. Configure the .env file, refer to the .env.example file for details.
# JMeter Configuration JMETER_HOME=/path/to/apache-jmeter-5.6.3 JMETER_BIN=${JMETER_HOME}/bin/jmeter # Optional: JMeter Java options JMETER_JAVA_OPTS="-Xms1g -Xmx2g"

💻 MCP Usage

  1. Connect to the server using an MCP-compatible client (e.g., Claude Desktop, Cursor, Windsurf)

  2. Send a prompt to the server:

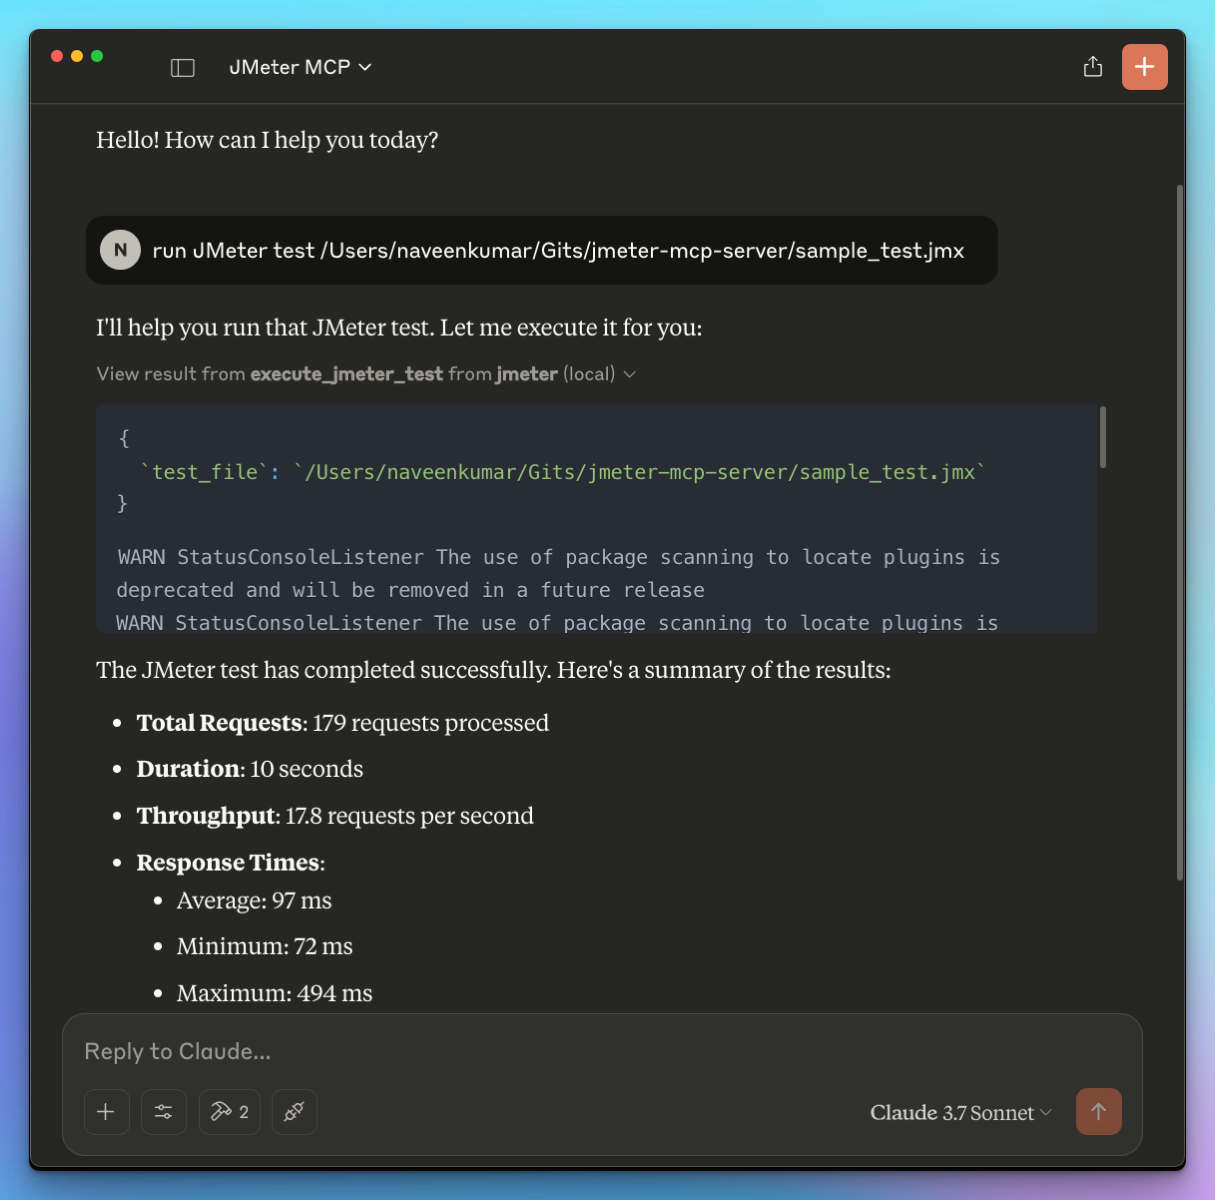
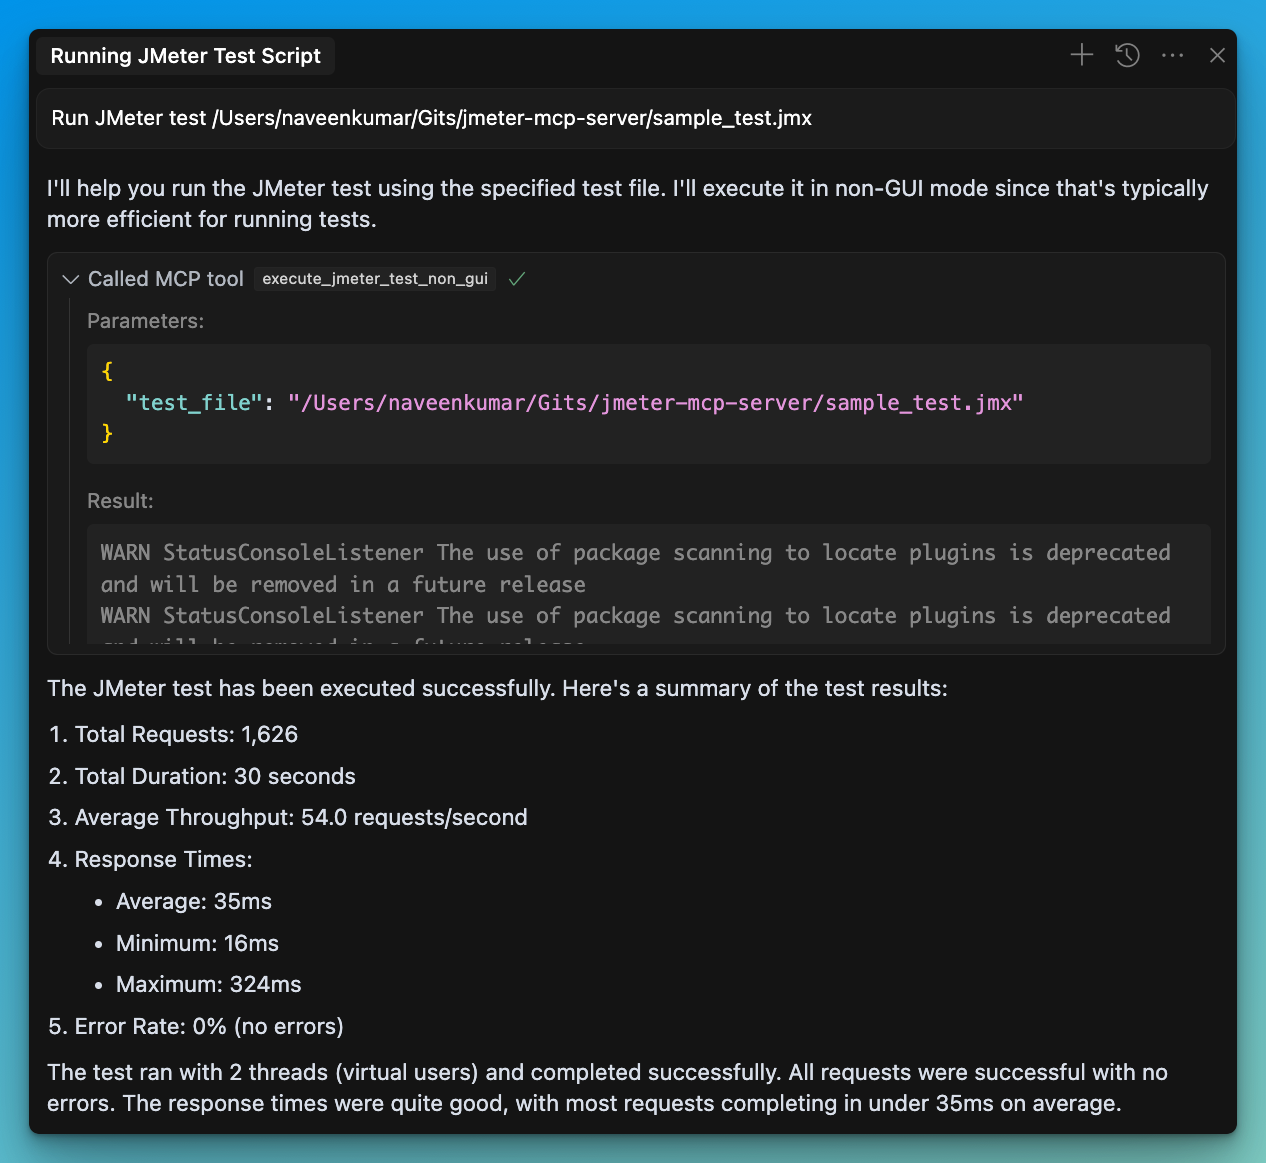
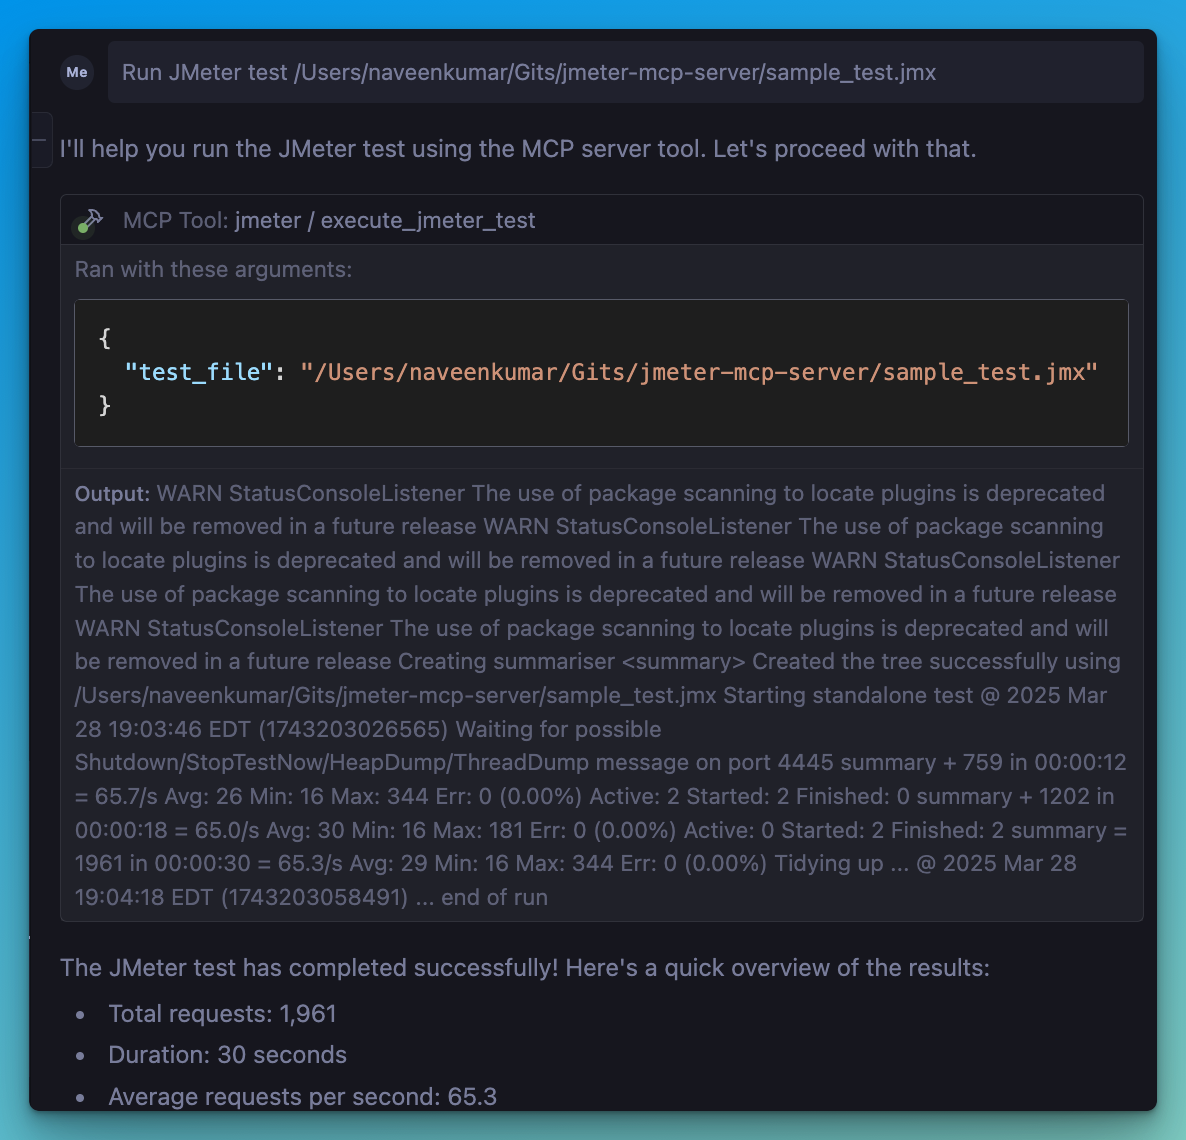
Run JMeter test /path/to/test.jmx
  1. MCP compatible client will use the available tools:

JMeter Execution Tools

  • 🖥️ execute_jmeter_test: Launches JMeter in GUI mode, but doesn't execute test as per the JMeter design
  • 🚀 execute_jmeter_test_non_gui: Execute a JMeter test in non-GUI mode (default mode for better performance)

Test Results Analysis Tools

  • 📊 analyze_jmeter_results: Analyze JMeter test results and provide a summary of key metrics and insights
  • 🔍 identify_performance_bottlenecks: Identify performance bottlenecks in JMeter test results
  • 💡 get_performance_insights: Get insights and recommendations for improving performance
  • 📈 generate_visualization: Generate visualizations of JMeter test results

🏗️ MCP Configuration

Add the following configuration to your MCP client config:

{ "mcpServers": { "jmeter": { "command": "/path/to/uv", "args": [ "--directory", "/path/to/jmeter-mcp-server", "run", "jmeter_server.py" ] } } }

✨ Use Cases

Test Execution

  • Run JMeter tests in non-GUI mode for better performance
  • Launch JMeter in GUI mode for test development
  • Generate JMeter report dashboards

Test Results Analysis

  • Analyze JTL files to understand performance characteristics
  • Identify performance bottlenecks and their severity
  • Get actionable recommendations for performance improvements
  • Generate visualizations for better understanding of results
  • Create comprehensive HTML reports for sharing with stakeholders

🛑 Error Handling

The server will:

  • Validate that the test file exists
  • Check that the file has a .jmx extension
  • Validate that JTL files exist and have valid formats
  • Capture and return any execution or analysis errors

📊 Test Results Analyzer

The Test Results Analyzer is a powerful feature that helps you understand your JMeter test results better. It consists of several components:

Parser Module

  • Supports both XML and CSV JTL formats
  • Efficiently processes large files with streaming parsers
  • Validates file formats and handles errors gracefully

Metrics Calculator

  • Calculates overall performance metrics (average, median, percentiles)
  • Provides endpoint-specific metrics for detailed analysis
  • Generates time series metrics to track performance over time
  • Compares metrics with benchmarks for context

Bottleneck Analyzer

  • Identifies slow endpoints based on response times
  • Detects error-prone endpoints with high error rates
  • Finds response time anomalies and outliers
  • Analyzes the impact of concurrency on performance

Insights Generator

  • Provides specific recommendations for addressing bottlenecks
  • Analyzes error patterns and suggests solutions
  • Generates insights on scaling behavior and capacity limits
  • Prioritizes recommendations based on potential impact

Visualization Engine

  • Creates time series graphs showing performance over time
  • Generates distribution graphs for response time analysis
  • Produces endpoint comparison charts for identifying issues
  • Creates comprehensive HTML reports with all analysis results

📝 Example Usage

# Run a JMeter test and generate a results file
Run JMeter test sample_test.jmx in non-GUI mode and save results to results.jtl

# Analyze the results
Analyze the JMeter test results in results.jtl and provide detailed insights

# Identify bottlenecks
What are the performance bottlenecks in the results.jtl file?

# Get recommendations
What recommendations do you have for improving performance based on results.jtl?

# Generate visualizations
Create a time series graph of response times from results.jtl

Be the First to Experience MCP Now