
Datadog
STDIOPython tool for Datadog API integration with monitor state tracking and Kubernetes log analysis.
Python tool for Datadog API integration with monitor state tracking and Kubernetes log analysis.
A Python-based tool to interact with Datadog API and fetch monitoring data from your infrastructure. This MCP provides easy access to monitor states and Kubernetes logs through a simple interface.
To install Datadog for Claude Desktop automatically via Smithery:
npx -y @smithery/cli install @didlawowo/mcp-collection --client claude
Required packages:
datadog-api-client
fastmcp
loguru
icecream
python-dotenv
uv
Create a .env file with your Datadog credentials:
DD_API_KEY=your_api_key
DD_APP_KEY=your_app_key
# Assuming you're on macOS
brew install claude-desktop

# Or download from official website
https://claude.ai/desktop
# on mac is
~/Library/Application\ Support/Claude/claude_desktop_config.json


# Add this to your claude config json
```json
    "Datadog-MCP-Server": {
      "command": "uv",
      "args": [
        "run",
        "--with",
        "datadog-api-client",
        "--with",
        "fastmcp",
        "--with",
        "icecream",
        "--with",
        "loguru",
        "--with",
        "python-dotenv",
        "fastmcp",
        "run",
        "/your-path/mcp-collection/datadog/main.py"
      ],
      "env": {
        "DD_API_KEY": "xxxx",
        "DD_APP_KEY": "xxx"
      }
    },
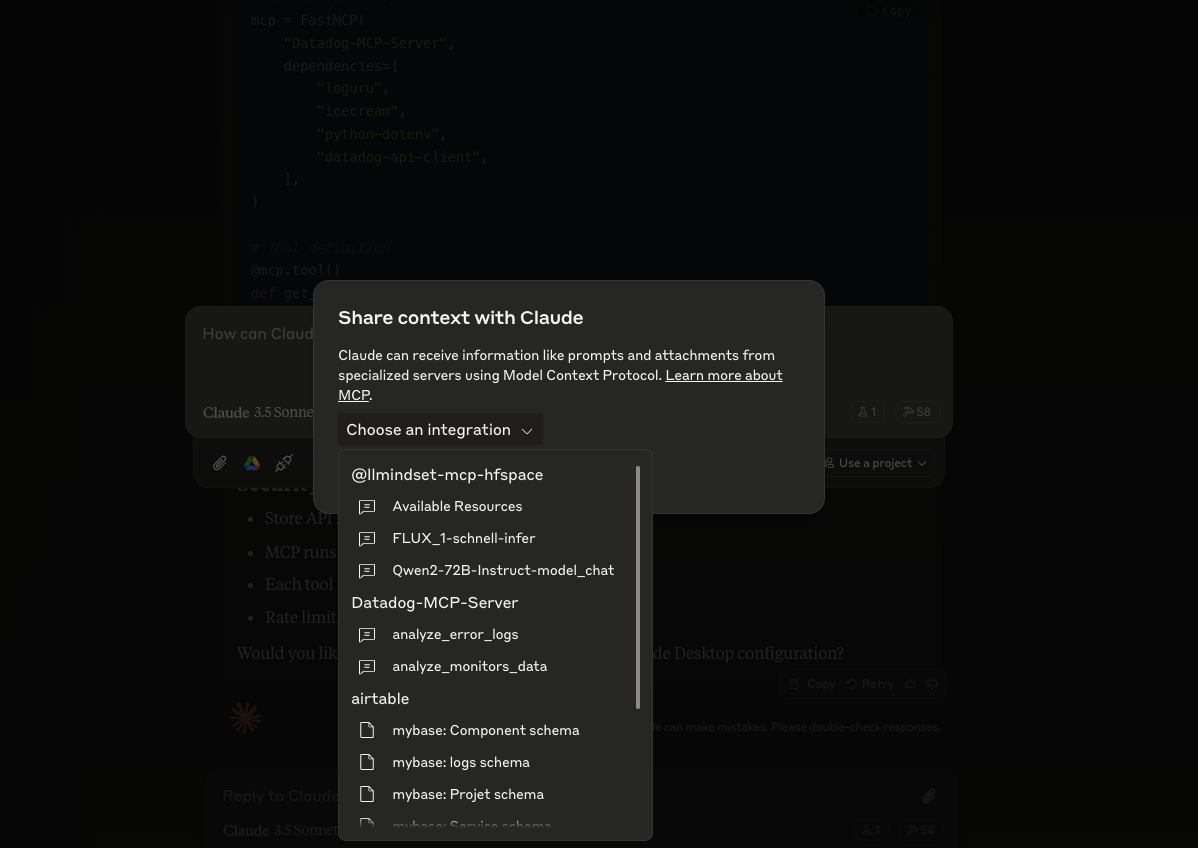
I'll add a section about MCP and Claude Desktop setup:
Model Context Protocol (MCP) is a framework allowing AI models to interact with external tools and APIs in a standardized way. It enables models like Claude to:
https://github.com/punkpeye/awesome-mcp-servers?tab=readme-ov-file
the LLM use provided function to get the data and use it
get_monitor_states(
    name: str,           # Monitor name to search
    timeframe: int = 1   # Hours to look back
)
Example:
response = get_monitor_states(name="traefik")

# Sample Output
{
    "id": "12345678",
    "name": "traefik",
    "status": "OK",
    "query": "avg(last_5m):avg:traefik.response_time{*} > 1000",
    "message": "Response time is too high",
    "type": "metric alert",
    "created": "2024-01-14T10:00:00Z",
    "modified": "2024-01-14T15:30:00Z"
}
get_k8s_logs(
    cluster: str,            # Kubernetes cluster name
    timeframe: int = 5,      # Hours to look back
    namespace: str = None    # Optional namespace filter
)
Example:
logs = get_k8s_logs(
    cluster="prod-cluster",
    timeframe=3,
    namespace="default"
)

# Sample Output
{
    "timestamp": "2024-01-14T22:00:00Z",
    "host": "worker-1",
    "service": "nginx-ingress",
    "pod_name": "nginx-ingress-controller-abc123",
    "namespace": "default",
    "container_name": "controller",
    "message": "Connection refused",
    "status": "error"
}
# Install as MCP extension
cd datadog
task install-mcp
check datadog connection in claude
.env# Launch MCP Inspector for debugging task run-mcp-inspector
The MCP Inspector provides:
API Authentication Errors
Error: (403) Forbidden
➡️ Check your DD_API_KEY and DD_APP_KEY in .env
MCP Connection Issues
Error: Failed to connect to MCP server
➡️ Verify your claude_desktop_config.json path and content
Monitor Not Found
Error: No monitor found with name 'xxx'
➡️ Check monitor name spelling and case sensitivity
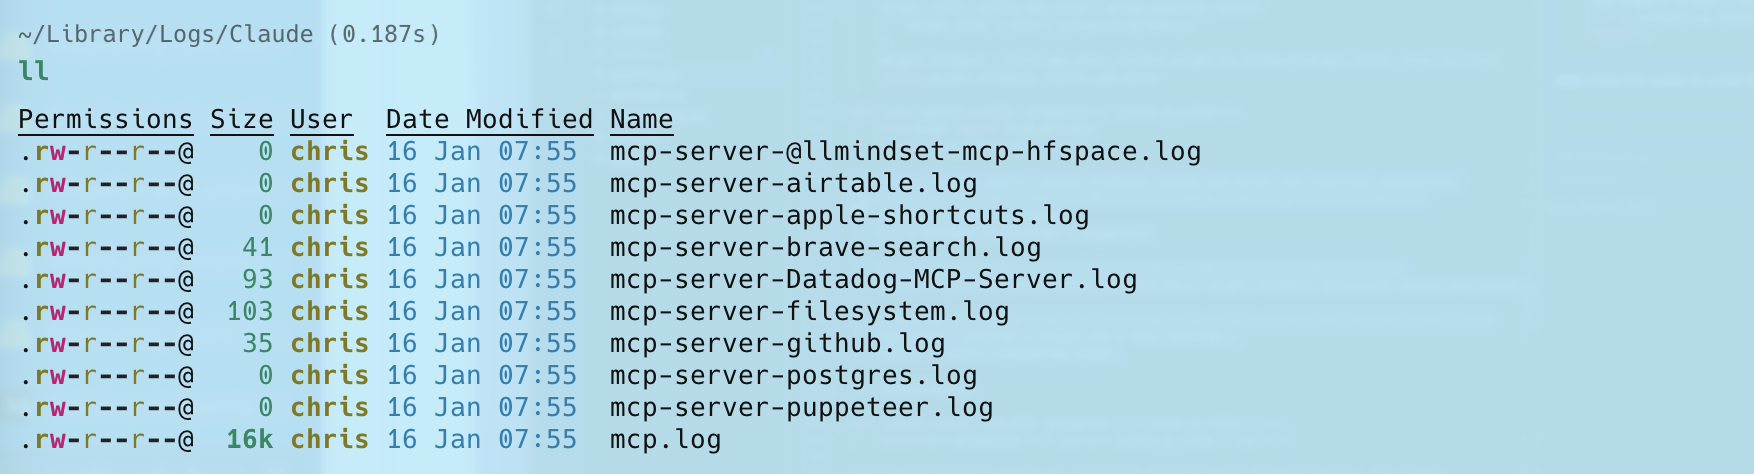
logs can be found here
Feel free to: