Bpftrace
STDIOMCP server that provides Linux kernel tracing using bpftrace and eBPF technology
MCP server that provides Linux kernel tracing using bpftrace and eBPF technology
A minimal MCP (Model Context Protocol) server that provides AI assistants with access to bpftrace kernel tracing capabilities.
Now implemented in Rust using the rmcp crate for better performance and type safety. The Python implementation is still available in the git history.

Debugging kernel issues traditionally requires deep eBPF expertise. MCPtrace changes that.
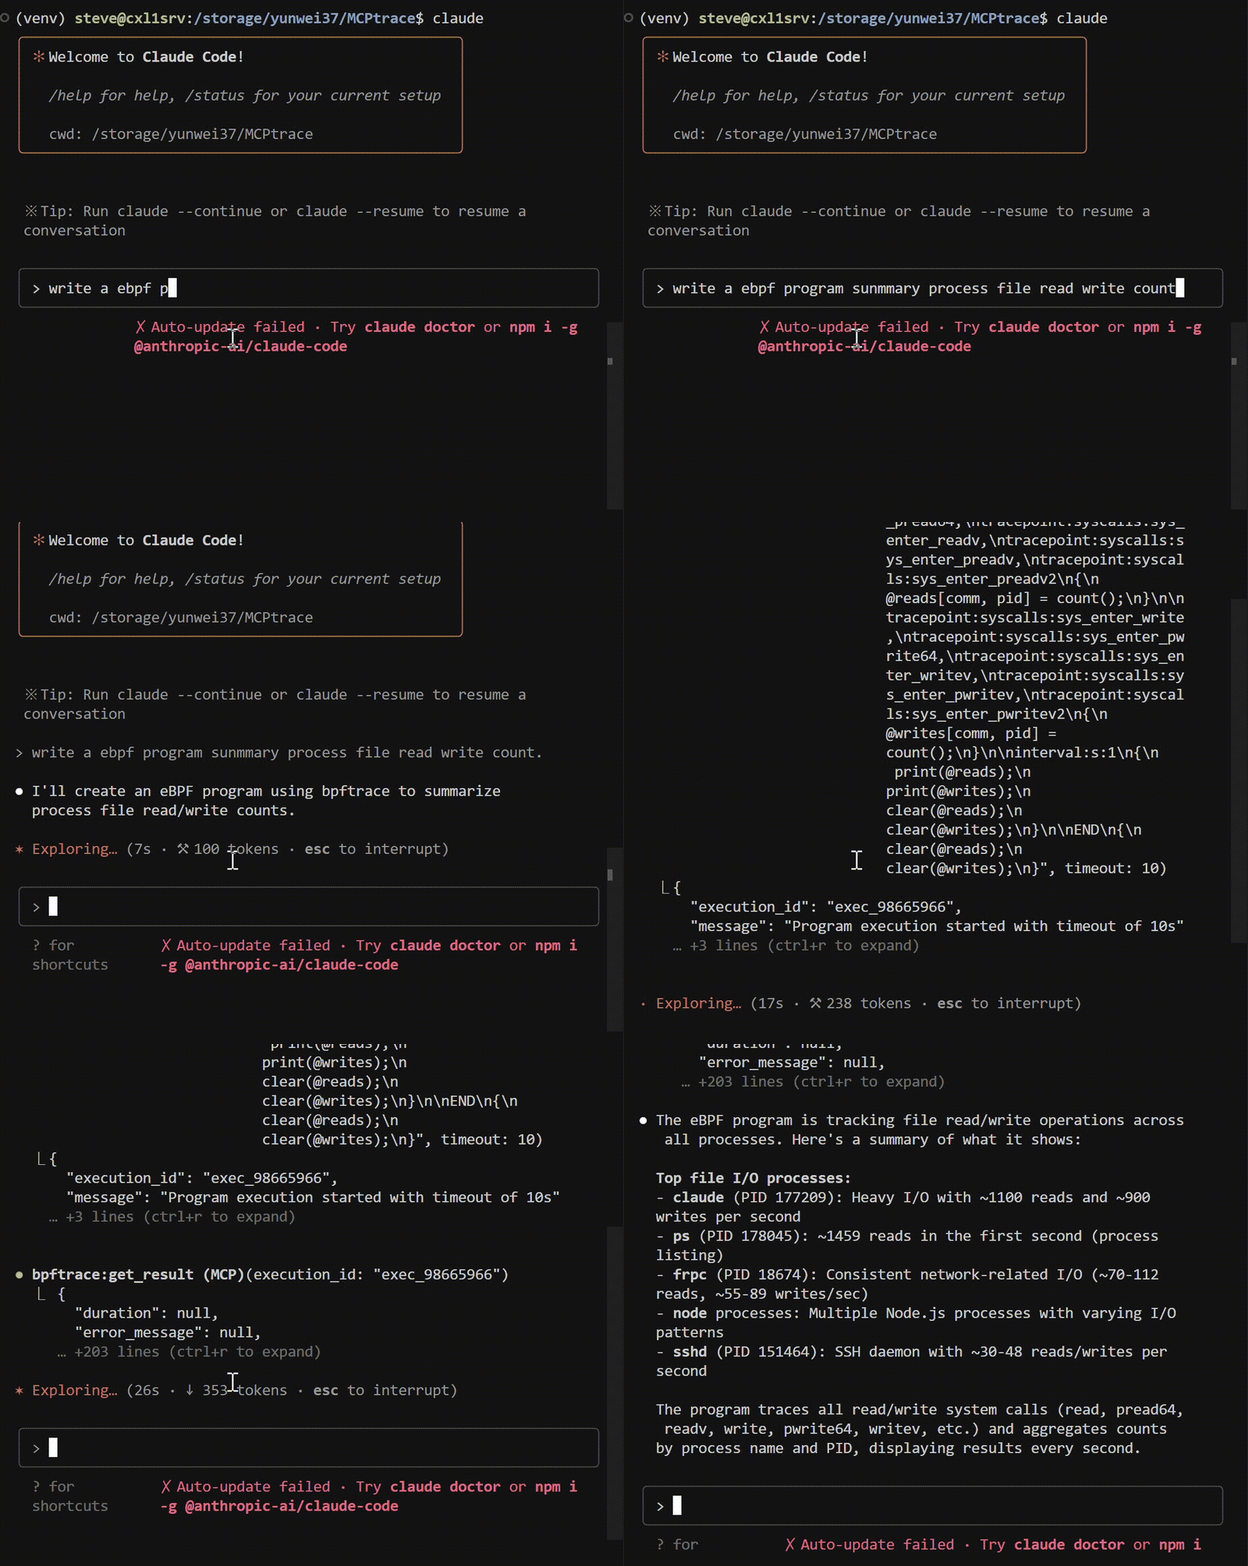
By bridging AI assistants with bpftrace (the perfect eBPF tracing language), MCPtrace lets you debug complex system issues through natural conversation. Just describe what you want to observe - "show me which processes are opening files" or "trace slow disk operations" - and let AI generate the appropriate kernel traces.
AI never gets root access. MCPtrace acts as a secure gateway, and with its rich collection of example scripts and probe information, AI has everything needed to help you understand what's happening inside your kernel. No eBPF expertise required.
curl --proto '=https' --tlsv1.2 -sSf https://sh.rustup.rs | sh
sudo apt-get install bpftrace  # Ubuntu/Debian
# or
sudo dnf install bpftrace      # Fedora
cargo install bpftrace-mcp-server
This will install the bpftrace-mcp-server binary to your Cargo bin directory (usually ~/.cargo/bin/).
Alternatively, you can build from source:
git clone https://github.com/yunwei37/MCPtrace
cd MCPtrace
cargo build --release
The binary will be available at ./target/release/bpftrace-mcp-server.
Use our automated setup scripts:
./setup/setup_claude.sh./setup/setup_claude_code.shFor detailed setup instructions and manual configuration, see setup/SETUP.md.
bpftrace-mcp-server
./target/release/bpftrace-mcp-server
cargo run --release
For manual setup instructions for Claude Desktop or Claude Code, see setup/SETUP.md.
await list_probes(filter="syscalls:*read*")
info = await bpf_info()
# Returns system info, kernel helpers, features, map types, and probe types
result = await exec_program(
    'tracepoint:syscalls:sys_enter_open { printf("%s\\n", comm); }',
    timeout=10
)
exec_id = result["execution_id"]
output = await get_result(exec_id)
print(output["output"])
.env file with your sudo password:
echo "BPFTRACE_PASSWD=your_sudo_password" > .env
sudo visudo
# Add: your_username ALL=(ALL) NOPASSWD: /usr/bin/bpftrace
The Rust server uses: